If you are planning well ahead and can choose almost any date, aim for May: at 109 mm of rain against September's 248 mm it is the driest month in Bergen, and it falls inside the May and June meltwater peak, when the fjord waterfalls run at their fullest. If your dates are already fixed, the season changes what the fjord looks like rather than whether you see it: the Mostraumen cruise sails year-round from the city centre with a warm indoor lounge.
Check dates on GetYourGuideFrom $79 · 3.5 hours · 4.7 from 10,432 reviews · free cancellation up to 24 hours before. Or check dates without leaving this page.
What about the other months? April is the third-driest month and the opening of the season, with over fourteen hours of daylight already. June gives you the longest days of the year, just under nineteen hours, with rain still among the lowest of the twelve. July and August are the warmest, at around 15.5°C, and the two months when the region is under most pressure. September is milder than May, 12.6°C against 10.7°C, and turns the fjord sides gold. What each of them costs you is set out month by month below.
Check the conditions for your date
Pick a date and this reads MET Norway, the Norwegian Meteorological Institute. Inside the forecast window it shows the actual forecast for Bergen; beyond it, the long-term average for that month. It always says which of the two you are looking at.
September: warm, long light, more rain
September averages 248 mm of rain in Bergen, 8.3 mm a day, against May's 3.5 mm. The mean temperature is 12.6°C, warmer than May, and you have about thirteen hours of daylight. Warmer than spring and wetter than spring is the trade of the main season.
- Rain248 mm for the month
- Temperature12.6°C mean
- Daylight12h 58m
- ShowingLong-term average
Source: MET Norway long-term averages for Bergen, and MET Norway sunrise and sunset for your date. Nothing here is a guess about a specific day more than ten days out, because nobody has that.
Bergen rain, month by month
Bergen gets about 2,496 mm of rain in an average year, and no month is dry. The difference between months is how much falls.
May takes 109 mm. September takes 248 mm. September and January both average 8.3 mm a day. May is also the only month of the twelve that averages under 4 mm a day, and April and June are the only other two under 5 mm. That is why the colour bands below group April, May and June together.
What 248 mm actually means
Monthly rainfall totals are easy to misread, so it helps to be exact about what they do and do not say.
The figure is the total depth of rain that falls across a whole month in an average year. September's 248 mm does not fall on one day, and it does not mean 248 mm every day. Spread evenly it works out at 8.3 mm a day against May's 3.5 mm, which is the fairest way to compare months of different lengths. Rain does not fall evenly through a month, so use the per-day column to compare months. It is not a forecast.
What the figure does not tell you is how many days were wet, how long the rain lasted, or your odds of a dry afternoon on a particular date. Those are different measurements and this page does not have them. A September with one enormous storm and a September with three drizzling weeks can both total 248 mm.
So September is not guaranteed to be wet, and May is not guaranteed to be dry. Bergen is rainy in every month of the year. The record does show one thing clearly. An average September delivers more than twice the rain of an average May.
In practical terms, the numbers do not tell you that your September cruise will be rainy. They tell you that you should be more prepared to deal with rain in September than in May.
| Month | Rain | Per day | Mean temp | Daylight | Visitors |
|---|---|---|---|---|---|
| January | 256 mm | 8.3 mm | 2.6°C | 6h 35m | 19 |
| February | 209 mm | 7.5 mm | 2.3°C | 9h 06m | 23 |
| March | 202 mm | 6.5 mm | 3.8°C | 11h 41m | 27 |
| April | 141 mm | 4.7 mm | 7.2°C | 14h 33m | 30 |
| May | 109 mm | 3.5 mm | 10.7°C | 17h 12m | 50 |
| June | 132 mm | 4.4 mm | 13.6°C | 18h 57m | 72 |
| July | 158 mm | 5.1 mm | 15.6°C | 18h 13m | 100 |
| August | 208 mm | 6.7 mm | 15.4°C | 15h 46m | 89 |
| September | 248 mm | 8.3 mm | 12.6°C | 12h 58m | 49 |
| October | 268 mm | 8.6 mm | 8.6°C | 10h 13m | 32 |
| November | 275 mm | 9.2 mm | 5.3°C | 7h 30m | 26 |
| December | 290 mm | 9.4 mm | 3.1°C | 5h 49m | 22 |
Two things in that table are easy to miss. The warmest month, July at 15.6°C, is also 45% wetter than May. And August, when a lot of families are tied to school holidays, takes 208 mm, 1.9 times May's total. So a July or August trip is warmer than spring but noticeably wetter, and a boat with an indoor lounge matters more than it does in May.
Is September a good time to go?
September has plenty going for it, but its advantages are often oversimplified.
It is warmer than May, 12.6°C against 10.7°C. Autumn colour starts to show on the fjord sides through the month. The summer peak has passed. Overnight stays across Vestland fall from about 1.09 million guest nights in July to roughly 536,000 in September.
September is not much quieter than May. Overnight stays across the region are almost identical in the two months, both at about half July's level. Those figures cover the whole county, not passengers on any one boat, so treat them as a general guide. They do not support the common assumption that September will feel noticeably emptier than late spring.
The main cost is rain. September averages 248 mm against May's 109, and daylight is down to about 12h 58m at mid-month from 17h 12m in May.
September is not a poor month. It is a different balance: warmer air and autumn colour, with more than twice the rain and four hours less daylight. If that suits you, September is a good choice, and a covered half-day cruise is the sensible way to take it. If you have complete flexibility, May gives you better odds of drier weather.
What the fjord looks like through the year
Rain and daylight frame a month. They do not tell you what you will see from the deck. This is the fjord's own year, which is what most people are really choosing between.
January to March. Snow on the mountain tops and often down to the water in the narrow stretches, low light, and a fjord that is dark, calm and open. It is sheltered sea water and does not normally freeze, so the half-day boat keeps running. By mid-March the day has stretched back to nearly twelve hours.
April. The snow line starts to lift and the first meltwater comes down. The lower slopes green up, the higher ones stay white, and you get both in one view. Rain is already well below the winter months and the days are past fourteen hours.
May. The melt is at full strength and so are the waterfalls, which is the single biggest visual difference between spring and late summer on this route. Along the Hardangerfjord the fruit orchards flower from about the middle of the month into early June, earlier in a warm spring and later in a cold one. This is also the driest month of the year, with the sun up for about seventeen hours.
June. Still plenty of meltwater in the falls, everything green to the summits, and the longest days of the year: the sun sets around eleven at night and it never goes fully dark. A full-day trip finishes in daylight with hours to spare.
July and August. The warmest months and the busiest. The waterfalls have eased as the snow above them runs out, so they are still there but thinner than in May. Long, light evenings, and more rain than spring; August in particular is closer to autumn than to May on rainfall.
September. Autumn colour usually starts on the fjord sides during the month, the air is still mild, and the light is shortening fast, from about seventeen hours in May to thirteen. Wetter than any of the summer months.
October. Usually the fullest autumn colour, on days when you can see it: this is the start of the wettest stretch of the year and storms become more likely. Daylight is down to about ten hours.
November and December. Dark, wet and dramatic. Under eight hours of light in November and under six at the solstice, snow returning to the tops, and the fjord close to its quietest of the year, for anyone who does not mind the weather. The half-day cruise still sails; the long day trips do not make much sense in this little light. Our guide to fjord cruises in October and November has the autumn timetables for each cruise.
What each month is best for
Tap a month for its rain, temperature, daylight and visitor pressure. The colours are a simple planning guide. Green is a month averaging under 5 mm of rain a day with at least fourteen hours of daylight, grey is over 6 mm a day with under twelve hours, amber is everything in between. Visitor numbers follow a different pattern, so they are shown as a separate figure.
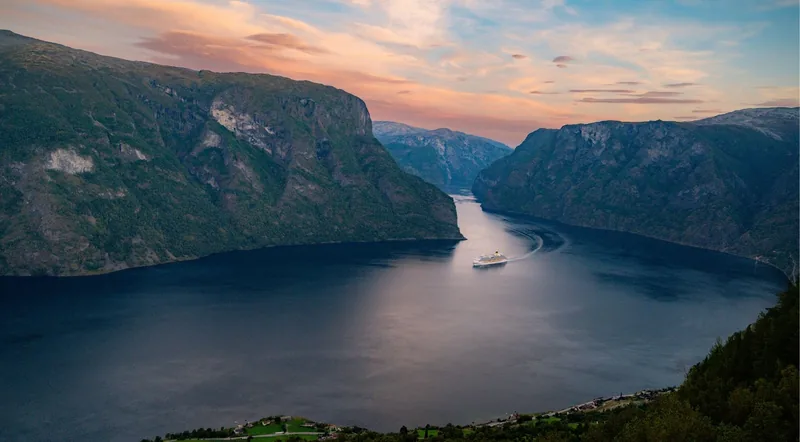
JANUARY
The quietest month of the year and the darkest. The Mostraumen boat still sails and the mountains are white, but you get under seven hours of light to see them in.
- Rain256 mm
- Rain per day8.3 mm
- Mean temp2.6°C
- Daylight6h 35m
- HighlightSnow on the tops
- Visitors19 vs Jul 100

FEBRUARY
The coldest month, and slightly drier than January. Cold clear spells are the ones to aim for; the fjord itself does not freeze.
- Rain209 mm
- Rain per day7.5 mm
- Mean temp2.3°C
- Daylight9h 06m
- HighlightCold, clear spells
- Visitors23 vs Jul 100

MARCH
Light comes back fast, to nearly twelve hours by mid-month from under six in December. Rain is still heavy and most long day tours have not restarted.
- Rain202 mm
- Rain per day6.5 mm
- Mean temp3.8°C
- Daylight11h 41m
- HighlightLight returns
- Visitors27 vs Jul 100
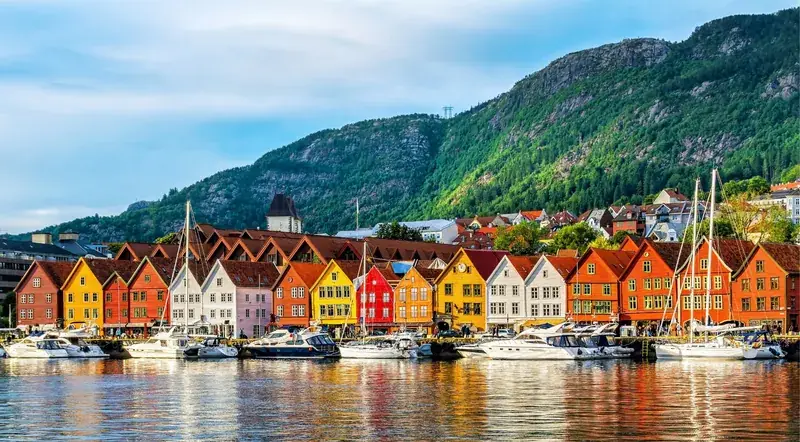
APRIL
The season opens. Under 5 mm of rain a day, over fourteen hours of light, and the snowmelt starting to feed the waterfalls, at under a third of July's visitor pressure.
- Rain141 mm
- Rain per day4.7 mm
- Mean temp7.2°C
- Daylight14h 33m
- HighlightSeason opens, quiet
- Visitors30 vs Jul 100
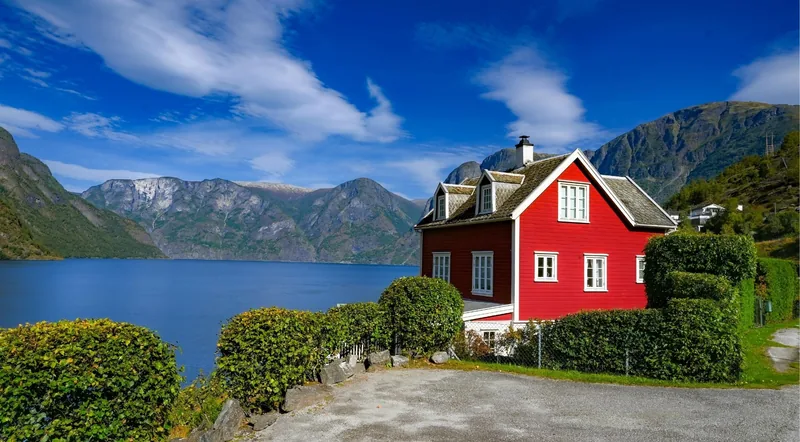
MAY
The driest month of the year in Bergen and the only one averaging under 4 mm of rain a day. Meltwater peaks, the Hardanger orchards flower from mid-month, and the region runs at about half of July.
- Rain109 mm
- Rain per day3.5 mm
- Mean temp10.7°C
- Daylight17h 12m
- HighlightDriest month, full waterfalls
- Visitors50 vs Jul 100
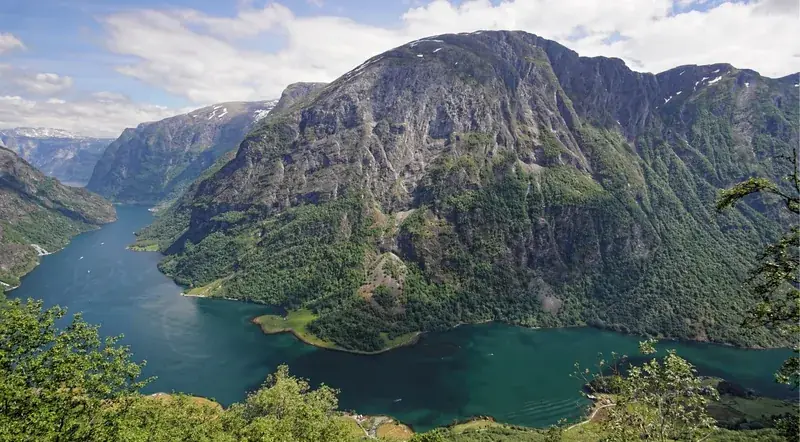
JUNE
The longest days of the year, just under nineteen hours at mid-month, with meltwater still running and rain still low. Visitor pressure climbs to about three-quarters of July.
- Rain132 mm
- Rain per day4.4 mm
- Mean temp13.6°C
- Daylight18h 57m
- HighlightLongest days
- Visitors72 vs Jul 100
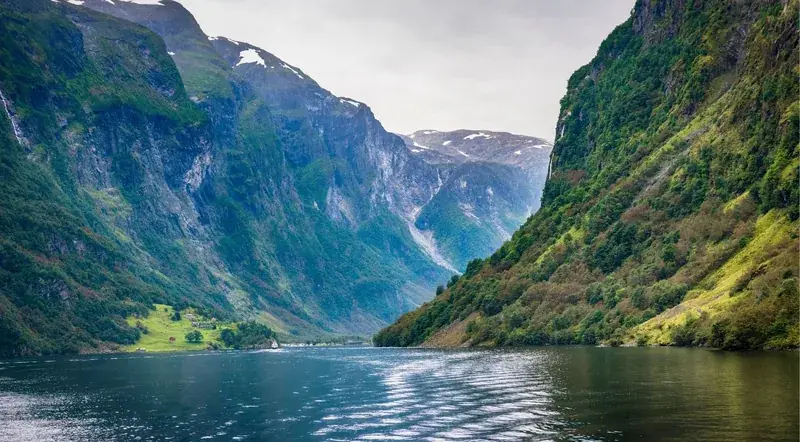
JULY
The warmest month and the measured peak of the year: Vestland records more overnight stays in July than in any other month, about double May or September. Everything runs, and so does the rain.
- Rain158 mm
- Rain per day5.1 mm
- Mean temp15.6°C
- Daylight18h 13m
- HighlightWarmest, busiest
- Visitors100 vs Jul 100

AUGUST
Almost as warm as July and nearly twice as wet as May, with visitor numbers still close to the peak. Long light into the evening, and the waterfalls thinner than in spring.
- Rain208 mm
- Rain per day6.7 mm
- Mean temp15.4°C
- Daylight15h 46m
- HighlightWarm sea, wetter
- Visitors89 vs Jul 100
SEPTEMBER
Warmer than May, and the month autumn colour reaches the fjord sides. Visitor numbers are about the same as May, and rainfall is more than twice May's.
- Rain248 mm
- Rain per day8.3 mm
- Mean temp12.6°C
- Daylight12h 58m
- HighlightAutumn colour, more rain
- Visitors49 vs Jul 100
OCTOBER
Peak autumn colour on the fjord sides, and the wettest stretch of the year starting. Storms become likelier and the long day tours thin out.
- Rain268 mm
- Rain per day8.6 mm
- Mean temp8.6°C
- Daylight10h 13m
- HighlightColour, then storms
- Visitors32 vs Jul 100
NOVEMBER
Under eight hours of light and 275 mm of rain. The half-day Mostraumen run keeps going; most full-day itineraries stop making sense.
- Rain275 mm
- Rain per day9.2 mm
- Mean temp5.3°C
- Daylight7h 30m
- HighlightDark and wet
- Visitors26 vs Jul 100
DECEMBER
The wettest month of the year and the shortest days, under six hours at the solstice. A trip for the city and the fjord in low light.
- Rain290 mm
- Rain per day9.4 mm
- Mean temp3.1°C
- Daylight5h 49m
- HighlightWettest, shortest
- Visitors22 vs Jul 100
Planning a wider Norway trip?
If Bergen is one stop of several, the same seasonal logic applies to what people usually pair it with: the Flåm Railway and the Nærøyfjord in the long-daylight months, Geirangerfjord in summer, Northern Lights and whale watching out of Tromsø between autumn and early spring, and the Lofoten Islands, Oslo and the Preikestolen hike from Stavanger.
Which cruise for which month
The season matters more when choosing the length of your cruise than when deciding whether to cruise at all. Long summer days make ten- and twelve-hour itineraries worthwhile; in late autumn and winter, shorter cruises let you see more of the scenery in daylight. Four options below, with the live price and review record for each.
From Bergen: The Original Fjord Cruise to Mostraumen
The half-day run up the Osterfjord to the Mostraumen strait. It sails year-round from the city centre, so it works in every month.
From $79 · 3.5 hours · 4.7 from 10,432 reviews
Book the Mostraumen cruiseBergen: Cruise to Beautiful Rosendal by the Hardangerfjord
Seven hours on the water down the Hardangerfjord to Rosendal, through the stretch where the meltwater comes off the mountains and the fruit orchards flower.
From $94 · 7 hours · 4.4 from 703 reviews
See Hardangerfjord datesBergen: UNESCO Fjord Cruise, Flåm & Stegastein – Incl. Lunch
Twelve hours out of Bergen for the UNESCO-listed Nærøyfjord, the Flåm valley and the Stegastein viewpoint. It only makes sense while the light lasts.
From $312 · 12 hours · 4.7 from 1,467 reviews
See the full-day optionBergen: City Sightseeing Cruise
Ninety minutes around Byfjorden and the Bryggen waterfront on an electric catamaran. Not a fjord day out, but the cheapest way onto the water in any weather.
From $46 · 1.5 hours · 4.3 from 16 reviews
See the city cruiseWhat rain does to a fjord cruise
Rain changes which cruise suits you more than whether to go at all. A wet forecast is mostly a reason to choose a different boat rather than to abandon the day.
The Mostraumen run out of central Bergen sails year-round on vessels with warm indoor lounges and open decks you can step onto when it eases. Heavy rain means watching through glass for stretches of the trip and going outside when it lifts. That is a genuinely different proposition from a coach day where the whole point is the view from a mountain road.
Rain has one benefit. The waterfalls along the Osterfjord run on water coming off the hills, so recent rain makes them stronger. There is a downside, though. Low cloud often comes with the rain, and when it sits on the fjord walls it takes the tops of them out of view. You keep the water and the waterfalls; you can lose the height, which on a fjord is a large part of the point.
What genuinely interrupts a sailing is wind, and wind is seasonal in a way rain is not: October to February is the stormy half of the year on this coast. If you are booking in those months, check the 24-hour free-cancellation cutoff so you can cancel if the forecast turns bad. For what to wear in either case, see our guide to packing for a Norway fjord cruise.
Daylight, and what it rules out
Bergen sits at 60.4 degrees north and the swing across the year is severe. Mid-May gives you 17h 12m of daylight. The June solstice gives you 18h 57m. By mid-September you are down to 12h 58m, by mid-November 7h 30m, and at the December solstice 5h 49m.
The number matters less than what it rules in and out. The eleven- and twelve-hour day tours to Nærøyfjord, Flåm and Stegastein spend a large share of the day travelling between the good bits. In June that is fine, because you finish with hours of light still in hand and every leg happens in daylight. Run the same itinerary in November and part of it takes place in the dark, so you pay for scenery you cannot see.
Long daylight is what makes a full-day fjord itinerary worth the money, and short daylight is what makes the half-day cruise the better choice. The 3.5-hour Mostraumen cruise still works in the dark months, which is why it is the best choice from October to March.
How crowded are Bergen and the fjords?
Three different things get called crowding on a fjord trip.
The region as a whole. Across the county that Bergen and the western fjords sit in, July has about 1.09 million overnight stays against roughly 541,000 in May and 536,000 in September, so high summer runs at about double either shoulder month. June, July and August together account for just under half the year's total. July is the busiest month, and the whole region feels it.
Bergen city centre. The port has capped cruise-ship arrivals since 2022 at four ships and 8,000 passengers a day, with shore power required for the fourth. That is a ceiling on the biggest single source of daytime crowding around Bryggen, the Fløibanen funicular and the Fish Market, and it bites from roughly May to September when the ocean liners call. It affects the city streets, not the boat.
The boat you are actually on. The fjord cruises on this page leave from Strandkaien and Zachariasbryggen in the middle of town, on vessels carrying under a hundred people. They are not the ships the cap is about, and a busy month does not put thousands of people on your deck. What it does mean is that sailings fill up. In a peak-season week the question is whether your preferred departure still has space.
On price, we did not gather per-date fares, so this page makes no claim about which month is cheapest to book. Our Bergen fjord cruise price page carries the live figures, and the deals guide covers the ways to bring the cost down.
Northern Lights and midnight sun: don't choose Bergen for either
Both appear in fjord cruise marketing. For a cruise from Bergen the answer is different for each.
The midnight sun
This one is a flat no. The midnight sun needs the Arctic Circle at 66 degrees 34 minutes north, and Bergen is at 60.4, about 690 km short. There is no date and no weather on which the sun fails to set over Bergen. What June does give you is a long dusk that never goes fully dark, which is genuinely beautiful and is not the same thing. For the true midnight sun you need to travel north of the Arctic Circle: Tromsø has it from roughly 20 May to 22 July.
The Northern Lights
This one is a maybe, not a never. The aurora does appear over the Bergen area occasionally, in the darker months and when geomagnetic activity is strong enough to push the auroral oval this far south, and when it happens it appears low on the northern horizon. October to March is the window. What it is not is reliable enough to build a trip around, and no fjord cruise from Bergen can sell it to you as part of the itinerary. If the lights are the reason for the journey, book Tromsø and treat a Bergen sighting as a bonus.
What's changed for fjord cruises in 2026
One rule changed this year and it affects which boats may enter the UNESCO-listed fjords. Since 1 January 2026, passenger ships under 10,000 gross tonnes must sail the World Heritage fjords — Geirangerfjorden, Nærøyfjorden, Aurlandsfjorden, Sunnylvsfjorden and Tafjorden — with no direct carbon dioxide or methane emissions. Battery propulsion, green hydrogen and certified biogas qualify, and shore power is compulsory where it exists. Larger ships have until 1 January 2032.
For a day trip from Bergen this is good news. The tourist boats on the Nærøyfjord leg fall under the smaller-vessel band, so the electric approach into the fjord is now required by law. The rule comes from the Norwegian Maritime Authority.
How we know this
Every figure on this page comes from a named source. Figures that change over time are dated.
- Rain and temperature. MET Norway standard normals for 1991-2020, measured at station SN50540, Bergen–Florida, about a kilometre from the harbour. These are the newest official normals in existence: the World Meteorological Organization sets them once a decade and 1991-2020 is the current set. Read via yr.no, MET Norway's own service.
- Visitor pressure. Statistics Norway table 14162, guest nights by region and month, Vestland, all accommodation types and all countries of residence, averaged over 2023-2025.
- Daylight. Computed from the sun's position at 60.383°N, 5.333°E, cross-checked against MET Norway's sunrise service and one independent solar calculator. The three agree to within about seven minutes, so figures here are rounded to the minute and no finer.
- The forecast in the date checker. MET Norway's public forecast for Bergen, fetched when you pick a date. Beyond its window the checker falls back to the monthly normal and says so on the card.
- Meltwater timing. Norwegian hydrology for western Norway puts the meltwater discharge maximum in May and June, which is also when NVE, the national water and energy directorate, runs its spring-flood forecasting. The fjord-side waterfalls run on that same meltwater.
- The fjord's year. Snow, meltwater and blossom timing come from the sources below; daylight from the sun calculation. Autumn colour timing is not published by any official body we could find, so the page says "usually" and gives no dates for it.
- Blossom timing. The Hardangerfjord regional tourist board and Visit Bergen both put the fruit blossom at roughly mid-May to early June, moving with the spring: the first week of May in a warm year, early June in a cold one.
- Prices, ratings and review counts. Read from each tour's own GetYourGuide listing on 7 September 2026, in US dollars.
- The ship cap and the emissions rule. The Port of Bergen for the four-ship, 8,000-passenger daily limit in force since 2022; the Norwegian Maritime Authority for the World Heritage fjord requirement that started on 1 January 2026.
What these numbers cannot tell you
These numbers have limits.
- Climate normals are long-run averages, not a forecast. They describe thirty years of Septembers. They say nothing about yours.
- Rainfall totals do not count wet days. We have monthly depth, not frequency, duration or your odds of a dry afternoon. Anyone quoting a "chance of rain" per month from these figures is going beyond them.
- Guest nights are a proxy for crowding, not a measure of it. They count overnight stays across a whole county. They do not count day visitors, cruise passengers who never stay ashore, or people on any particular boat.
- We have no per-date fares, so there is no cheapest month on this page.
- We have no cancellation statistics for any operator, so the page says wind is the seasonal risk and stops there.
- Prices and review counts move. Both were read on one day; the booking page is the truth.